Obsidian 插件:Charts View
插件名片
概述
Obsidian 中的数据可视化解决方案,支持图表和图形。

原文出处
下面自述文件的来源于 Readme
Readme(翻译)
下面是 obsidian-chartsview-plugin 插件的自述翻译


Obsidian 图表视图插件
这是一个基于 Ant Design Charts 的数据可视化插件,适用于 Obsidian。支持绘图和图表。
图表模板
词频统计
使用命令 插入模板->词频统计 来插入代码块。
#-----------------#
#- 图表类型      -#
#-----------------#
type: 词云

#-----------------#
#- 图表数据      -#
#-----------------#
data: "wordcount:Words"

#-----------------#
#- 图表选项      -#
#-----------------#
options:
  wordField: "word"
  weightField: "count"
  colorField: "count"
  wordStyle:
    rotation: 30
多个文件
数据: "wordcount:Words,PARA,@Inbox/"所有文件
数据:"wordcount:/"文件夹
data: "wordcount:@Inbox/"饼图
使用命令 Charts View: Insert Template -> Pie 来插入代码块。

词云
使用命令 Charts View: Insert Template -> WordCloud 来插入代码块。

矩形树图
使用命令 Charts View: Insert Template -> Treemap 来插入代码块。

DualAxes
使用命令 Charts View: Insert Template -> DualAxes 来插入代码块。

混合
使用 data.<任意名称> 和 options.<任意名称> 来设置数据和选项。保持数据和选项的 <任意名称> 相同。
使用命令 Charts View: Insert Template -> Mix 来插入代码块。

柱状图
使用命令 Charts View: Insert Template -> Bar 来插入代码块。

组织树图
使用命令 Charts View: Insert Template -> OrganizationTreeGraph 来插入代码块。

雷达图
使用命令 Charts View: Insert Template -> Radar 来插入代码块。

TinyLine
使用命令 Charts View: Insert Template -> TinyLine 来插入代码块。

Dataviewjs 示例(柱状图)
使用 dataviewjs 来展示图表数据。
使用命令 Charts View: Insert Template -> Dataviewjs示例(柱状图) 来插入代码块。

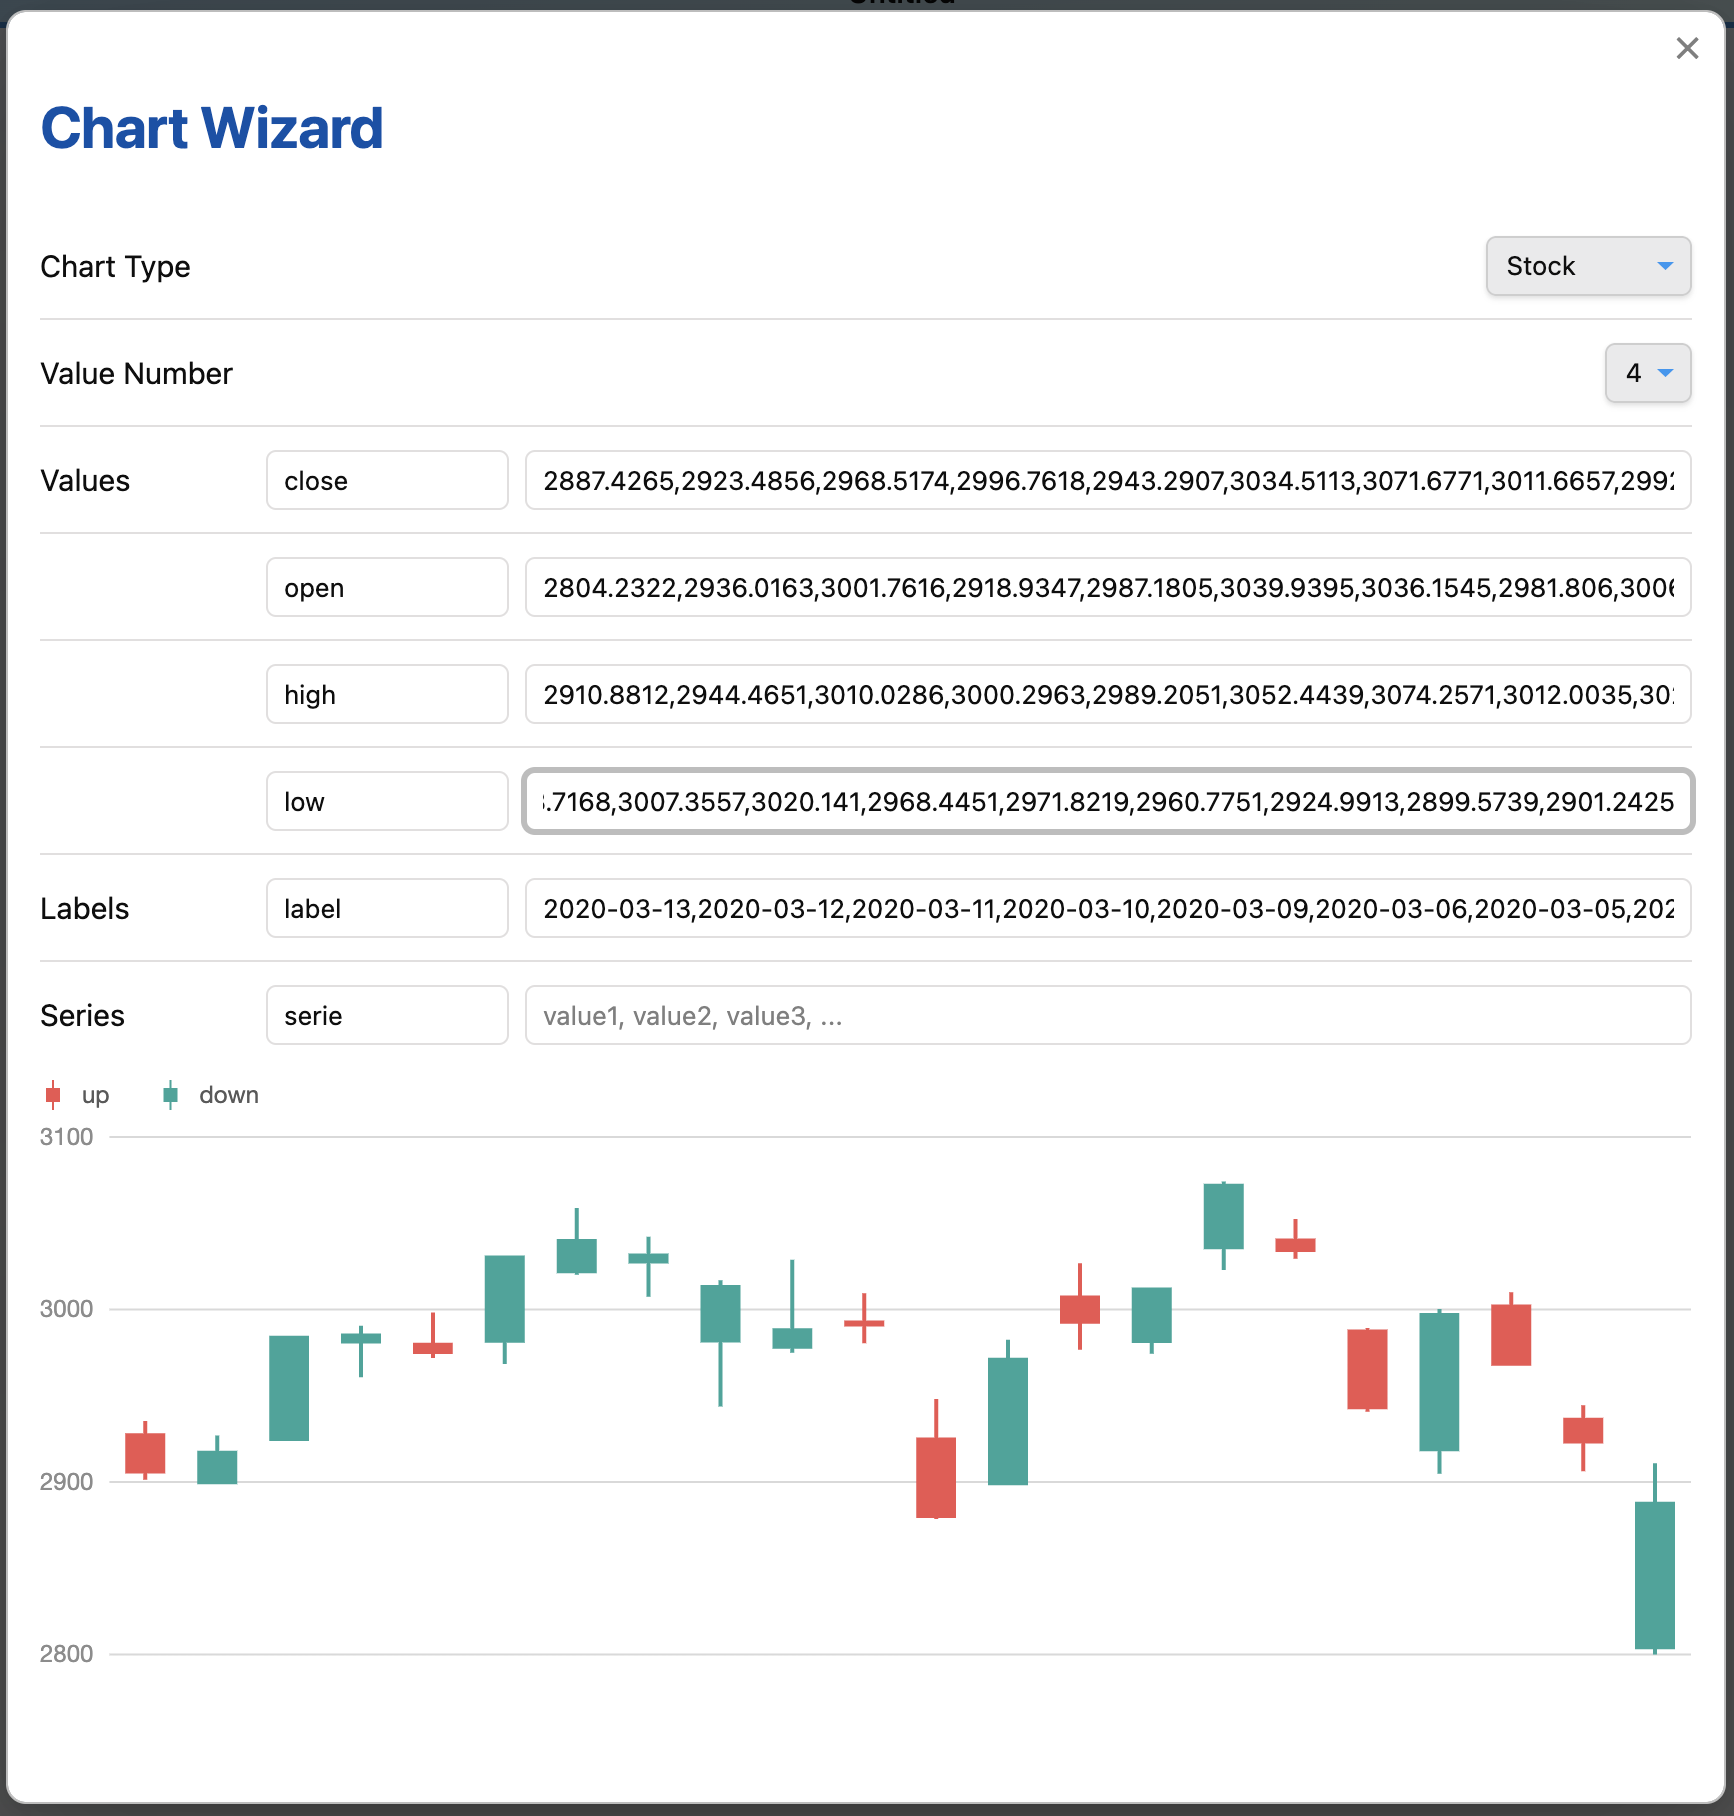
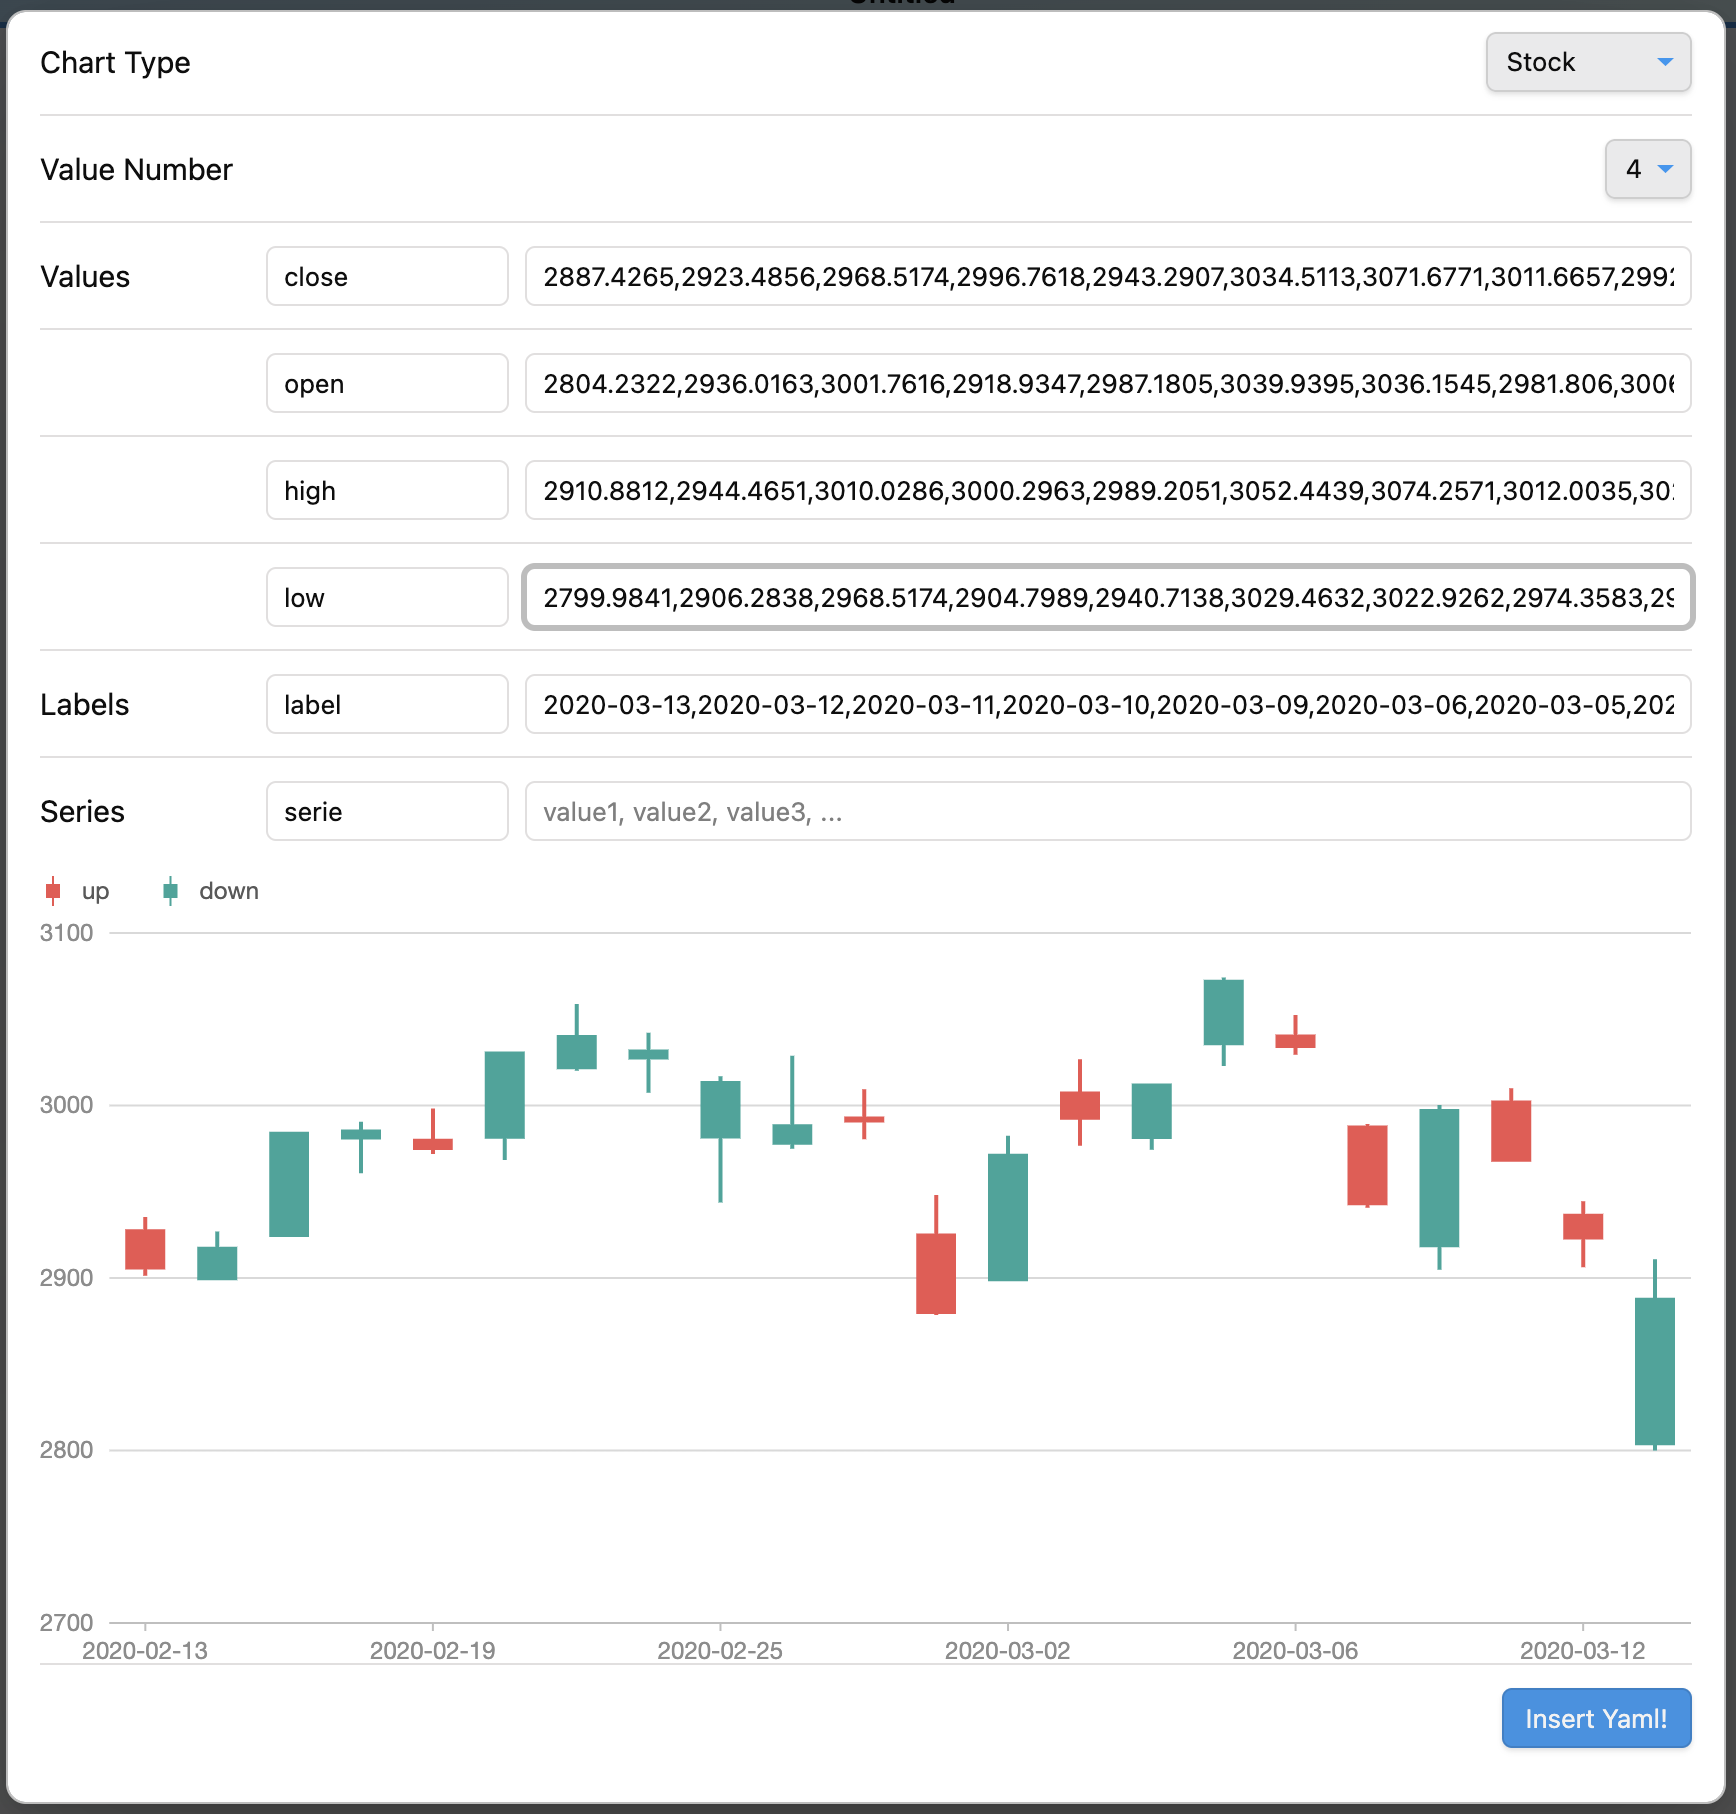
图表向导
使用命令 Charts View: Wizard 来插入代码块。


来自 CSV 文件的数据
从外部 CSV 文件导入数据(桌面)
使用命令“Charts View: Import data from external CSV file”从 CSV 文件中插入数据。
从内部 CSV 文件加载数据
从数据路径加载 CSV 文件。
数据路径应在设置中指定。
#-----------------#
#- 图表类型      -#
#-----------------#
type: Mix

#-----------------#
#- 图表数据      -#
#-----------------#
data.area:
  - time: 1246406400000
    temperature: [14.3, 27.7]
  - time: 1246492800000
    temperature: [14.5, 27.8]
  - time: 1246579200000
    temperature: [15.5, 29.6]
  - time: 1246665600000
    temperature: [16.7, 30.7]
  - time: 1246752000000
    temperature: [16.5, 25.0]
  - time: 1246838400000
    temperature: [17.8, 25.7]

data.line: LineData.csv

#-----------------#
#- 图表选项      -#
#-----------------#
options:
  appendPadding: 8
  syncViewPadding: true
  tooltip:
    shared: true
    showMarkers: false
    showCrosshairs: true
    offsetY: -50

options.area:
  axes: {}
  meta:
    time:
      type: 'time'
      mask: 'MM-DD'
      nice: true
      tickInterval: 172800000
      range: [0, 1]
    temperature:
      nice: true
      sync: true
      alias: '温度范围'
  geometries:
    - type: 'area'
      xField: 'time'
      yField: 'temperature'
      mapping: {}

options.line:
  axes: false
  meta:
    time:
      type: 'time'
      mask: 'MM-DD'
      nice: true
      tickInterval: 172800000
      range: [0, 1]
    temperature:
      sync: 'temperature'
      alias: '温度'
  geometries:
    - type: 'line'
      xField: 'time'
      yField: 'temperature'
      mapping: {}
    - type: 'point'
      xField: 'time'
      yField: 'temperature'
      mapping:
        shape: 'circle'
        style:
          fillOpacity: 1
多个 CSV 文件
#-----------------#
#- 图表类型      -#
#-----------------#
类型:DualAxes

#-----------------#
#- 图表数据      -#
#-----------------#
数据:DualAxesData.csv,DualAxesData.csv

#-----------------#
#- 图表选项      -#
#-----------------#
选项:
  x轴字段:'time'
  y轴字段:['value', 'count']
  y轴:
    value:
      最小值:0
      标签:
        格式化器:
          function formatter(val) {
            return ''.concat(val, '个');
          }
  几何选项:
    - 几何:'column'
    - 几何:'line'
      线条样式:
	    线宽:2
数据视图插件集成
允许的方法
- dv.current()
- dv.pages(source?)
- dv.pagePaths(source?)
- dv.page(path)
- dv.array(value)
- dv.isArray(value)
- dv.date(text)
- dv.fileLink(path, embed?, display-name?)
- dv.date(pathlike)
- dv.query(source, settings?)
- dv.io
互动
启用搜索交互
通过添加一个选项 enableSearchInteraction,在点击图表元素时启用 Obsidian 中的搜索交互。
使用默认值:
#-----------------#
#- chart options -#
#-----------------#
options:
  ...
  enableSearchInteraction: true
或自定义:
#-----------------#
#- chart options -#
#-----------------#
options:
  ...
  enableSearchInteraction:
    field: 'word'
operator: 'path'field指示搜索关键字的获取位置。operator枚举自 Obsidian搜索操作符:
| operator | Obsidian 搜索操作符 |
|---|---|
default | |
tag | tag: |
path | path: |
file | file: |
task | task: |
taskTodo | task-todo: |
taskDone | task-done: |
matchCase | match-case: |
ignoreCase | ignore-case: |
line | line: |
block | block: |
content | content: |
section | section: |
fileopen | 打开 Vault 内的文件 |
请参阅https://github.com/caronchen/obsidian-chartsview-plugin/wiki/Chart-examples
手动安装插件
- 将
main.js、styles.css、manifest.json复制到你的 vault 文件夹VaultFolder/.obsidian/plugins/obsidian-chartsview-plugin/中。
Ant Design Charts 演示
反馈交流
其他渠道
版权声明
版权声明:所有 PKMer 文章如果需要转载,请附上原文出处链接。


