obsidian社区插件
Obsidian 插件:Vega Visualizations

插件ID:obsidian-vega_readme
vega_readme
vega_readme:用于渲染 Vega 或 Vega-Lite 数据可视化图,如折线图和散点图。
Obsidian 插件:Vega Visualizations
插件名片
概述
用于渲染 Vega 或 Vega-Lite 数据可视化图,如折线图和散点图。
原文出处
下面自述文件的来源于 Readme
Readme(翻译)
下面是 obsidian-vega 插件的自述翻译
Vega 可视化插件
在 Obsidian笔记应用 中使用 JSON 格式的 Vega 或 Vega-Lite 规范创建高度可定制的数据可视化。有关格式化 Vega规范 和 Vega-Lite规范 的更多文档可以在 Vega 网站上找到。
要添加图表或绘图,请创建一个代码块,语言设置为 vega 或 vega-lite,然后添加 JSON 规范。
例子
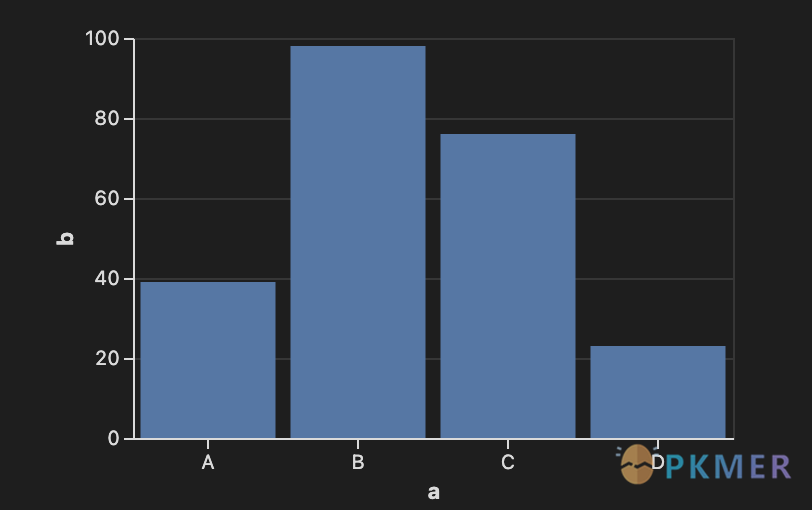
使用 Vega-Lite 的柱状图
```vega-lite
{
  "width": 300,
  "data": {
    "values": [
      {"a": "A", "b": 39}, {"a": "B", "b": 98},
      {"a": "C", "b": 76}, {"a": "D", "b": 23}
    ]
  },
  "mark": "bar",
  "encoding": {
    "x": { "field": "a", "type": "nominal", "axis": { "labelAngle": 0 } },
    "y": { "field": "b", "type": "quantitative" }
  }
}
```
使用 Vega 绘制折线图
```vega
{
  "width": 400,
  "height": 200,
  "data": [
    {
      "name": "table",
      "values": [
        { "x": 0, "y": 50 }, { "x": 1, "y": 0 },
        { "x": 2, "y": 30 }, { "x": 3, "y": 40 },
        { "x": 4, "y": 60 }, { "x": 5, "y": 25 }
      ]
    }
  ],
  "scales": [
    {
      "name": "x",
      "type": "point",
      "range": "width",
      "domain": { "data": "table", "field": "x" }
    },
    {
      "name": "y",
      "type": "linear",
      "range": "height",
      "domain": { "data": "table", "field": "y" }
    }
  ],
  "axes": [
    { "orient": "bottom", "scale": "x" },
    { "orient": "left", "scale": "y" }
  ],
  "marks": [
    {
      "type": "line",
      "from": { "data": "table" },
      "encode": {
        "enter": {
          "x": { "scale": "x", "field": "x" },
          "y": { "scale": "y", "field": "y" },
          "interpolate": { "value": "monotone" }
        }
      }
    }
  ]
}
```
致谢
Vega,Vega-Lite
BSD 3-Clause “New” or “Revised” License
版权所有(c)2015-2021,华盛顿大学交互数据实验室