
Obsidian 插件:echarts 图表化展示你的笔记
插件名片
概述
obsidian-echarts 插件是一款自定义程度很高的插件,结合 dataview 查询到的数据源,生成丰富的图表。echarts 插件是把 Apache ECharts 库移植到了 obsidian 中,所以官方的示例代码稍加修改即可用于 obsidian 中。目前插件集成的 echarts 版本为 5.3.2。
图表类型
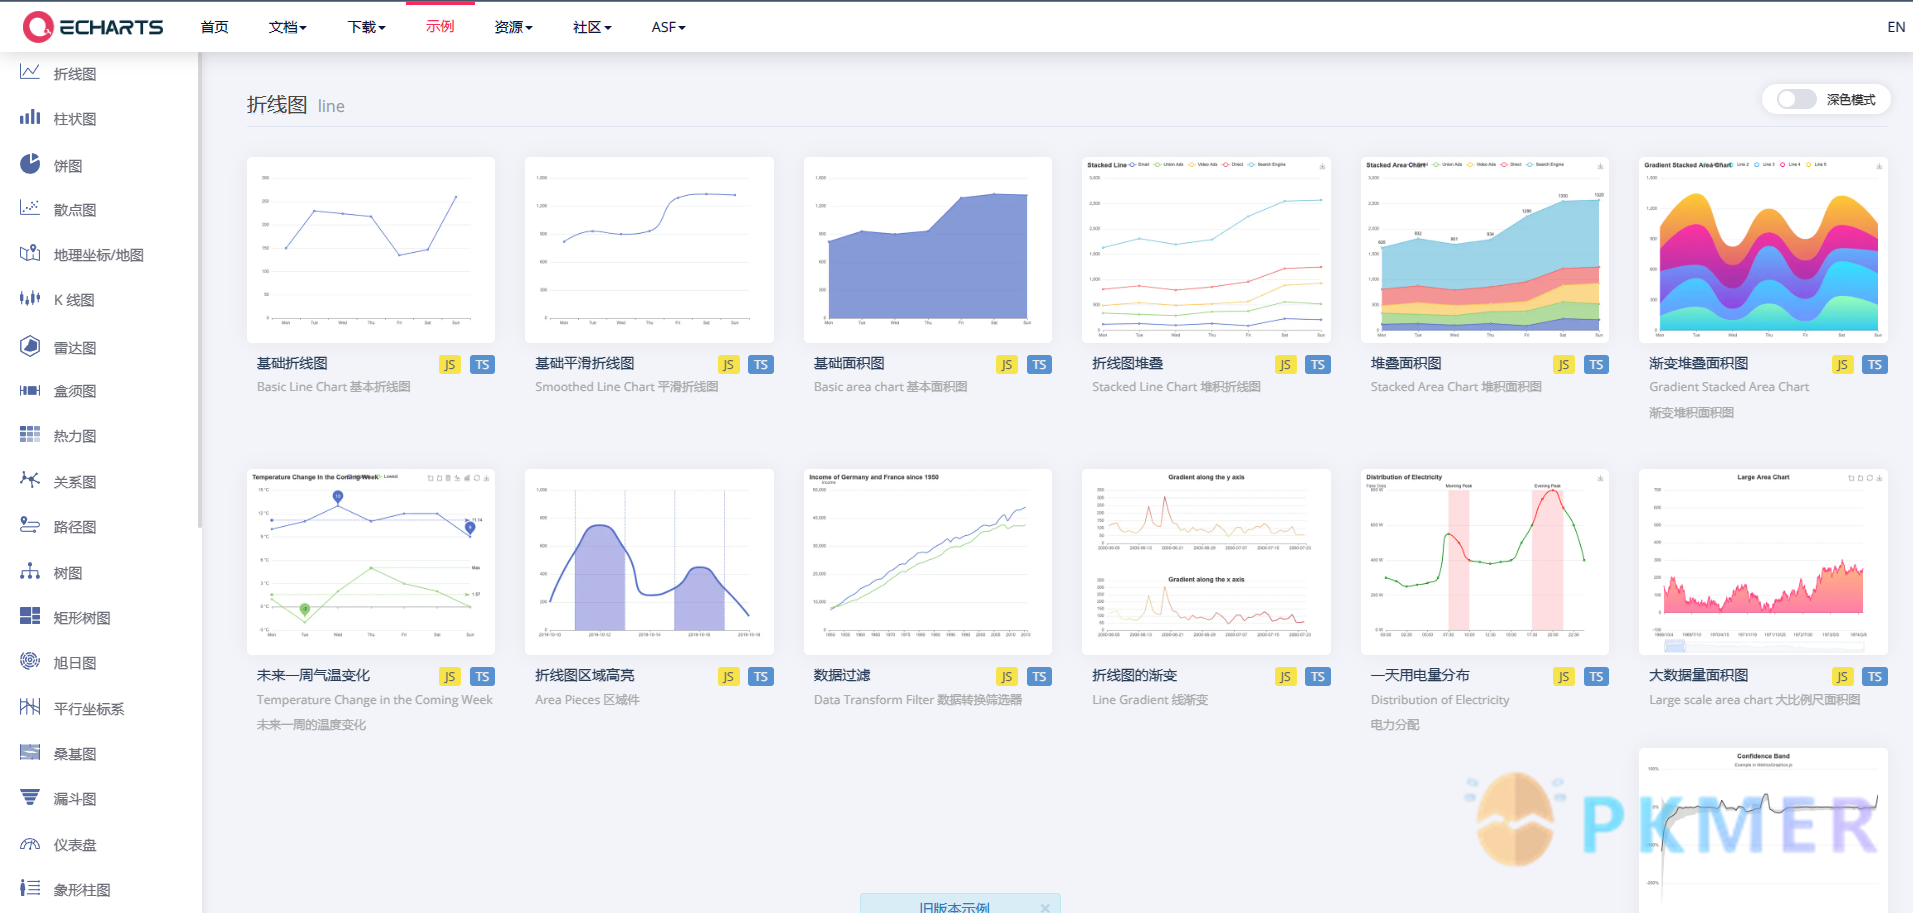
除了官方给的示例代码外下面社区也有大量的范例可供参考:
- 数据可视化技术分享-echarts热门组件 - Powered by Discuz!
- DataInsight
- PPChart - 让图表更简单
- 首页 - ECharts Demo集,echarts gallery社区,Make A Pie,分享你的可视化作品isqqw.com
- series-bar柱状图 - makeapie echarts图表可视化案例
- 首页 - Made A Pie
- MCChart (zhangmuchen.top)
- 全网echarts案例资源大总结和echarts的高效使用技巧(细节版) - 掘金 (juejin.cn)
使用方法
下面教程针对高级使用者,在编写 dataviewjs 代码时给予参考。后面给出新手直接可以用的代码。
点击事件绑定
通过在源数据添加下面字段绑定点击事件效果。 目前支持的类型有 tag,content,file,path 指定这类类型可以点击事件调用 Obsidian Search operators 如果指定的是 file 和 path 类型 需要添加字段比如 data[‘file’]=‘filename’ 可以实现组合搜索 假设 datas 是要展示的数据。
datas.forEach((data)=>{
	data['search']='tag'
	data['file']='filename'
	data['path']='path'
})
如果不指定,默认绑定的是传入的 data 数组中的 index 对应的文件。 **If not specified, the default binding is to the file with index in the incoming data array. **
渲染容器
将下方代码到 option 选项后即可渲染 Render the code below after putting it into the option
app.plugins.plugins['obsidian-echarts'].render(option, this.container)举例
一个简单的柱状图案例
教你如何把官方示例用到 obsidian 中。
比如这个简单的柱状图示例,Examples - Apache ECharts
把左边的代码复制到笔记的代码块中
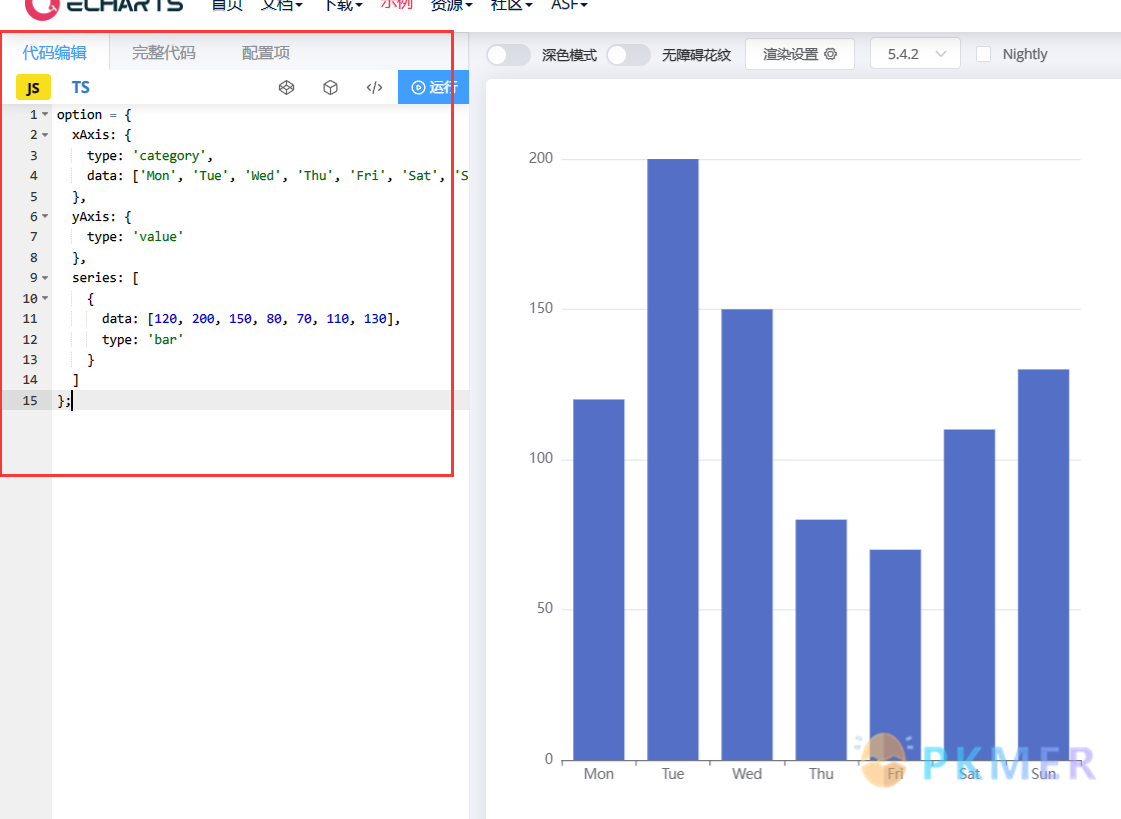
代码的意思就是 定义了 x 轴,y 轴的属性,和序列对应的值。
官方给的例子数据都是定义好的,人为的输入进去的,这在实际应用中是不现实的,所以需要借助 dataview 工具帮我们筛选需要的数据进去。
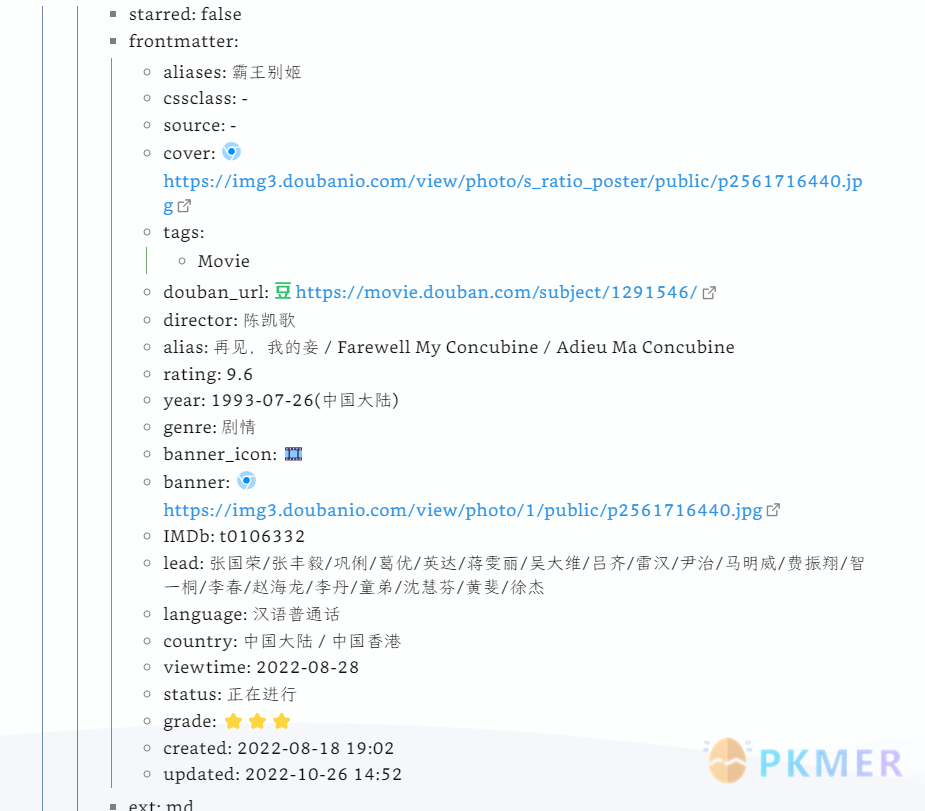
现在我们假设库里有一堆笔记,标签都是 movie,yaml 区域有很多笔记属性 比如
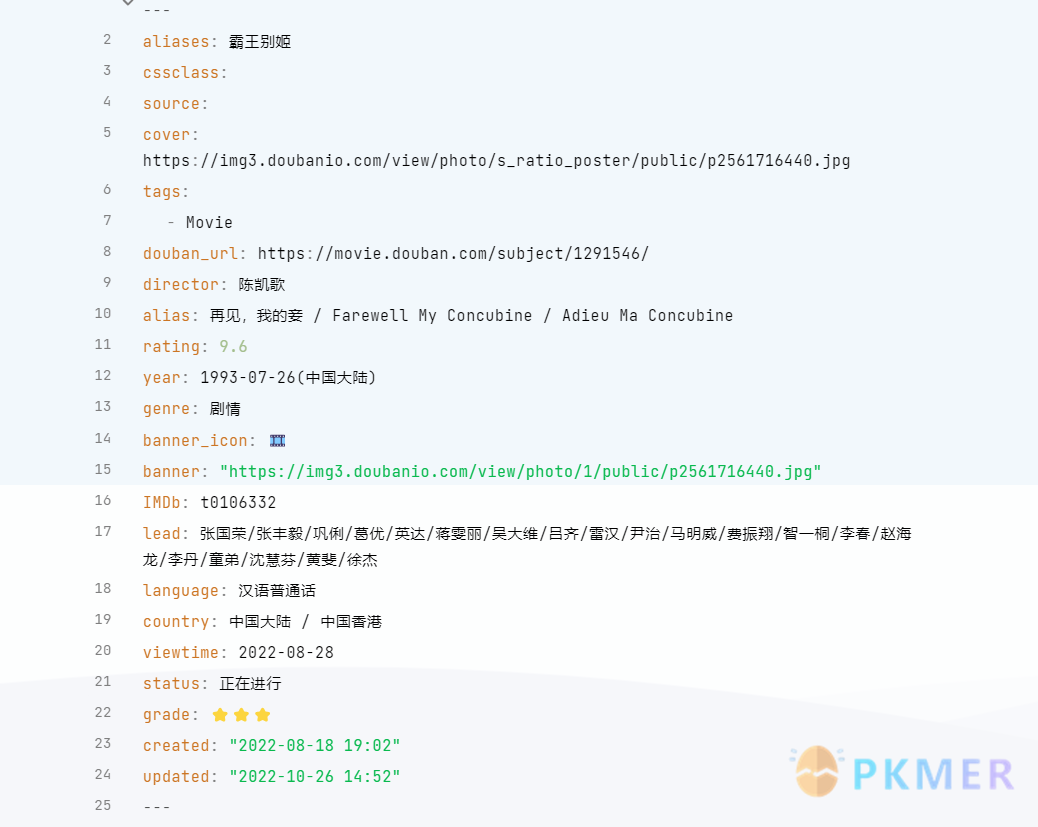
现在我需要把 Movie 标签的笔记全部收集过来,然后柱状图展示每个笔记的 rating 评分情况。
我们先用 dataviewjs 实现这个需求。把标签为 movie 的笔记并且含有 rating 字段的笔记全部列出来。
```dataviewjs
const pages = dv.pages("#Movie").filter((page) => {return page.rating })
dv.list(pages)
```
现在会把符号要求的文件属性全部列出来
我们只需要文件名和 rating 评分这两个属性 于是继续这样写
创建两个数组 ratingList 用来收集评分。fileList 用来收集文件名。
const ratingList = []
const fileList = []
pages.forEach((page)=>{
	fileList.push(page.name)
	ratingList.push(page.rating)
})
有这两个数组 就按官方示例把对应的内容替换下
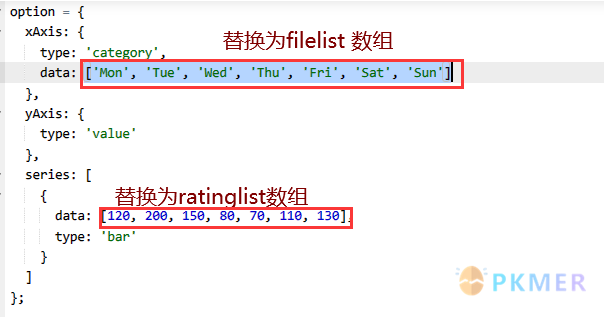
替换后 最后加上一句
app.plugins.plugins['obsidian-echarts'].render(option, this.container) 意思是把 option 的内容推送到 obsidian-echarts 插件去渲染。
完整代码如下:
```dataviewjs
const pages = dv.pages("#Movie").filter((page) => {return page.rating})
const ratingList = []
const fileList = []
pages.forEach((page)=>{
	fileList.push(page.name)
	ratingList.push(page.rating)
})
const option = {
  xAxis: {
    type: 'category',
    data: fileList,
  },
  yAxis: {
    type: 'value'
  },
  series: [
    {
      data: ratingList,
      type: 'bar'
    }
  ]
};

app.plugins.plugins['obsidian-echarts'].render(option, this.container)
```
最后的效果
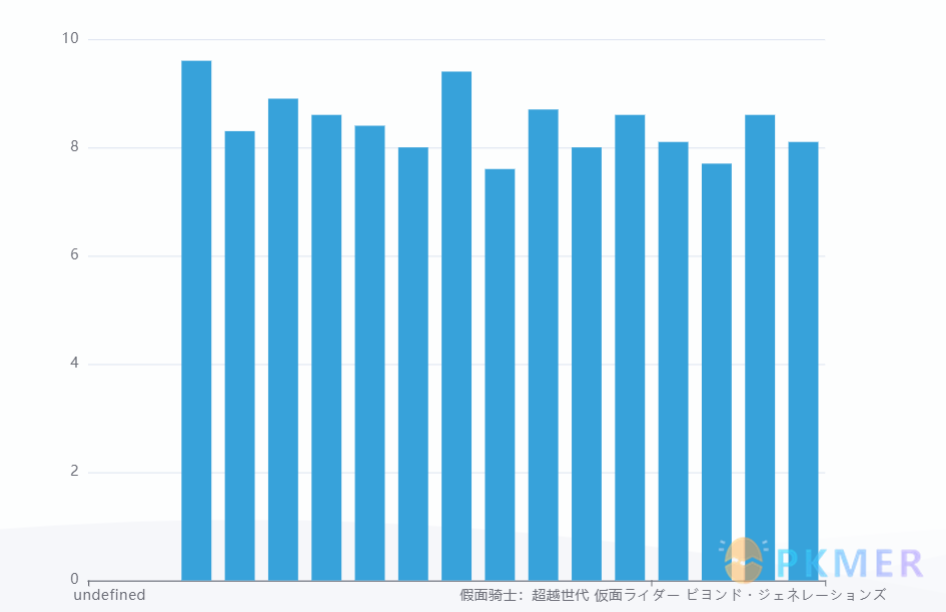
可以看出 x 轴很多文件名不显示应该是因为文件名太长,显示不下,于是稍微改下代码让文件名斜着显示。
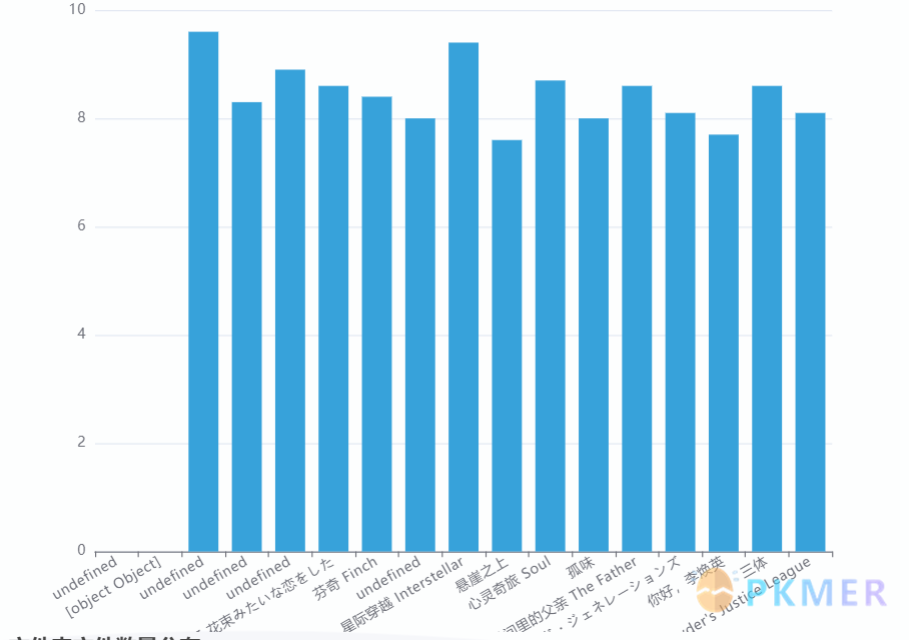
在 x 轴添加代码 axisLabel: {rotate: 30},
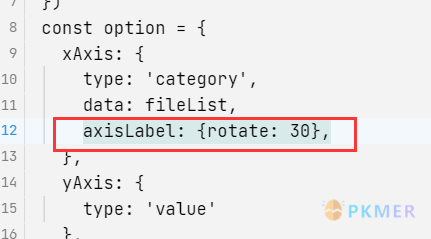
最后效果如下
动态显示笔记大小和数量分布
dataviewjs 代码:
```dataviewjs
## 关键代码 用dataview语法查询需要统计的数据源,只需要日期,体积,数量三个维度
 let pages= dv.pages()
           .groupBy(p => p.file.cday.toFormat("yyyy-MM"))
           .map(p => ({cday: p.key , count: p.rows.length,wordcout:p.rows.values}))
           .array();
  function sumItem(arr1, arr2) {
            if (arr2.length == 0) {
                return arr1;
            } else {
                arr1.map(function(value, index) {
                    arr2[index] += value;
                })
            }
            return arr2;
        }

const xData = []
const yData = []
const y2Data = []

pages.forEach((page)=>{
	xData.push(page.cday)
	yData.push(page.count)
	y2Data.push(page.wordcout)
})
 let wordscout=[]
 let num =0
	for (let i = 0; i < y2Data.length; i++) {
		for (let j = 0; j < y2Data[i].length; j++) {
				num+=Number(y2Data[i][j].file.size)
		}
	wordscout[i]=parseInt((num/3)/8)
	}
const y3Data =sumItem(yData,wordscout)
console.log(y3Data)

let option = {
   backgroundColor: "#344b58",
  title: {
    text: "笔记数量和大小统计",
    subtext: "BY Cuman",
    x: "4%",

    textStyle: {
      color: "#fff",
      fontSize: "22",
    },
    subtextStyle: {
      color: "#90979c",
      fontSize: "16",
    },
  },
  tooltip: {
    trigger: "axis",
    axisPointer: {
      type: "shadow",
      textStyle: {
        color: "#fff",
      },
    },
  },
  grid: {
    borderWidth: 0,
    top: 110,
    bottom: 95,
    textStyle: {
      color: "#fff",
    },
  },
  legend: {
    x: "4%",
    top: "8%",
    textStyle: {
      color: "#90979c",
    },
    data: ["字数", "大小", "总和"],
  },

  calculable: true,
  xAxis: [
    {
      type: "category",
      axisLine: {
        lineStyle: {
          color: "#90979c",
        },
      },
      splitLine: {
        show: false,
      },
      axisTick: {
        show: false,
      },
      splitArea: {
        show: false,
      },
      axisLabel: {
        interval: 0,
      },
      data: xData,
    },
  ],
  yAxis: [
    {
      type: "value",
      splitLine: {
        show: false,
      },
      axisLine: {
        lineStyle: {
          color: "#90979c",
        },
      },
      axisTick: {
        show: false,
      },
      axisLabel: {
        interval: 0,
      },
      splitArea: {
        show: false,
      },
    },
  ],
  dataZoom: [
    {
      show: true,
      height: 30,
      xAxisIndex: [0],
      bottom: 30,
      start: 10,
      end: 80,
      handleIcon:
        "path://M306.1,413c0,2.2-1.8,4-4,4h-59.8c-2.2,0-4-1.8-4-4V200.8c0-2.2,1.8-4,4-4h59.8c2.2,0,4,1.8,4,4V413z",
      handleSize: "110%",
      handleStyle: {
        color: "#d3dee5",
      },
      textStyle: {
        color: "#fff",
      },
      borderColor: "#90979c",
    },
    {
      type: "inside",
      show: true,
      height: 15,
      start: 1,
      end: 35,
    },
  ],
  series: [
    {
      name: "笔记体积",
      type: "bar",
      stack: "总量",
      barMaxWidth: 35,
      barGap: "10%",
      itemStyle: {
        normal: {
          color: "rgba(255,144,128,1)",
          label: {
            show: true,
            textStyle: {
              color: "#fff",
            },
            position: "inside",
            formatter: function (p) {
              return p.value > 0 ? p.value : "";
            },
          },
        },
      },
      data: wordscout,
    },
    {
      name: "笔记数量",
      type: "bar",
      stack: "总量",
      itemStyle: {
        normal: {
          color: "rgba(0,191,183,1)",
          barBorderRadius: 0,
          label: {
            show: true,
            position: "outside",
            formatter: function (p) {
              return p.value > 0 ? p.value : "";
            },
          },
        },
      },
      data: yData,
    },

    {
      name: "总数",
      type: "line",
      symbolSize: 10,
      symbol: "circle",
      itemStyle: {
        normal: {
          color: "rgba(252,230,48,1)",
          barBorderRadius: 0,
          label: {
            show: false,
            position: "top",
            formatter: function (p) {
              return p.value > 0 ? p.value : "";
            },
          },
        },
      },
      data: y3Data,
    },
  ],
};
## 关键代码 用来把数据推送到插件
app.plugins.plugins['obsidian-echarts'].render(option, this.container)

```
词云
可以把库中出现的关键词用词云标识,这里以查询库中文件所用的标签,形成标签词云为例。

```dataviewjs
## 关键代码 用dataview语法查询文件标签,按标签内容,标签出现的次数聚合
const datas=dv.pages().flatMap(p => p.file.etags).groupBy(p => p).map(p => ({name: p.key.replace("#",""), value: p.rows.length})).array();
datas.forEach((data)=>{
	data['search']='tag'
})
 console.log(datas)
var option = {
backgroundColor: 'transparent',
	tooltip: {},
    series: [{
        type: 'wordCloud',

        shape: 'pentagon',

        keepAspect: false,
        width: '100%',
        height: '100%',
        right: null,
        top: '-10%',
        // Text size range which the value in data will be mapped to.
        // Default to have minimum 12px and maximum 60px size.

        sizeRange: [20, 80],

        rotationRange: [-30, -30],
        rotationStep: 45,

        // size of the grid in pixels for marking the availability of the canvas
        // the larger the grid size, the bigger the gap between words.

        gridSize: 8,

        // set to true to allow word being draw partly outside of the canvas.
        // Allow word bigger than the size of the canvas to be drawn
        drawOutOfBound: false,

        // If perform layout animation.
        // NOTE disable it will lead to UI blocking when there is lots of words.
        layoutAnimation: true,

        // Global text style
        textStyle: {
            fontFamily: 'sans-serif',
            fontWeight: 'bold',
            // Color can be a callback function or a color string
            color: function () {
                // Random color
                return 'rgba(' + [
                Math.round(Math.random() * 128) + 64,
                Math.round(Math.random() * 150),
                 Math.round(Math.random() * 128) + 50,
                 0.7
                            ].join(',') + ')';
            }
        },
        emphasis: {
            textStyle: {
                textShadowBlur: 2,
                color: '#528'
            }
        },

        // Data is an array. Each array item must have name and value property.
        data: datas
    }]
}
app.plugins.plugins['obsidian-echarts'].render(option, this.container)
```
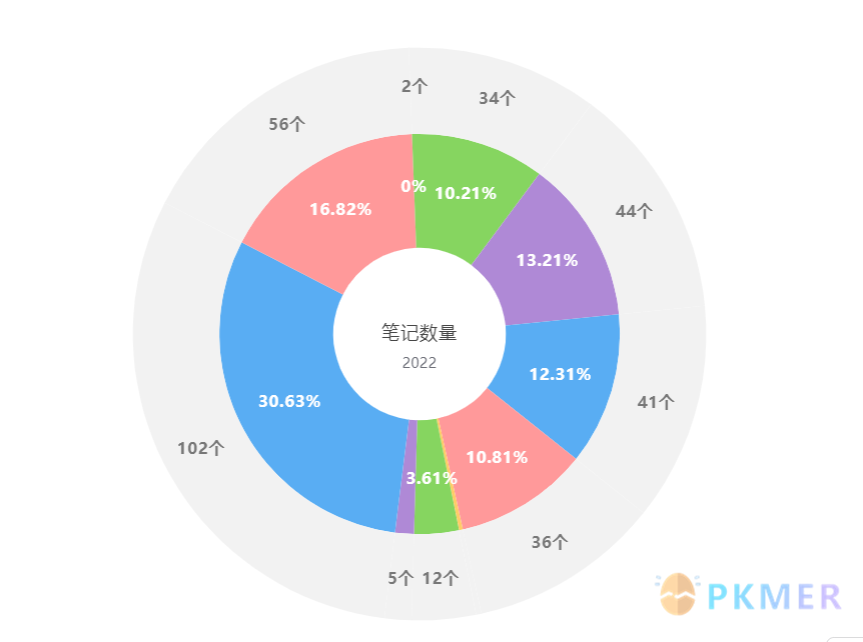
扇形图
这里通过统计库中所有文件形成笔记数量的分布图
```dataviewjs
const data = []
app.vault.root.children.forEach((child)=>{
if(child.path.split(".")[1] != "md"){
//console.log(child.path)
data.push({name: child.path, value: dv.pages(`"${child.path}"`).length})
}
})
const options = {
backgroundColor: '#fff',
title: {
text: '笔记数量',
subtext: '2022',
x: 'center',
y: 'center',
textStyle: {
fontWeight: 'normal',
fontSize: 16
}
},
tooltip: {
show: true,
trigger: 'item',
formatter: "{b}: {c} ({d}%)"
},
legend: {
orient: 'horizontal',
bottom: '0%',
data: ['<10w', '10w-50w', '50w-100w', '100w-500w', '>500w']
},
series: [{
type: 'pie',
selectedMode: 'single',
radius: ['25%', '58%'],
color: ['#86D560', '#AF89D6', '#59ADF3', '#FF999A', '#FFCC67'],
label: {
normal: {
position: 'inner',
formatter: '{d}%',
textStyle: {
color: '#fff',
fontWeight: 'bold',
fontSize: 14
}
}
},
labelLine: {
normal: {
show: false
}
},
data: data
}, {
type: 'pie',
radius: ['58%', '83%'],
itemStyle: {
normal: {
color: '#F2F2F2'
},
emphasis: {
color: '#ADADAD'
}
},
label: {
normal: {
position: 'inner',
formatter: '{c}个',
textStyle: {
color: '#777777',
fontWeight: 'bold',
fontSize: 14
}
}
},
data: data
}]
};
app.plugins.plugins['obsidian-echarts'].render(options, this.container)
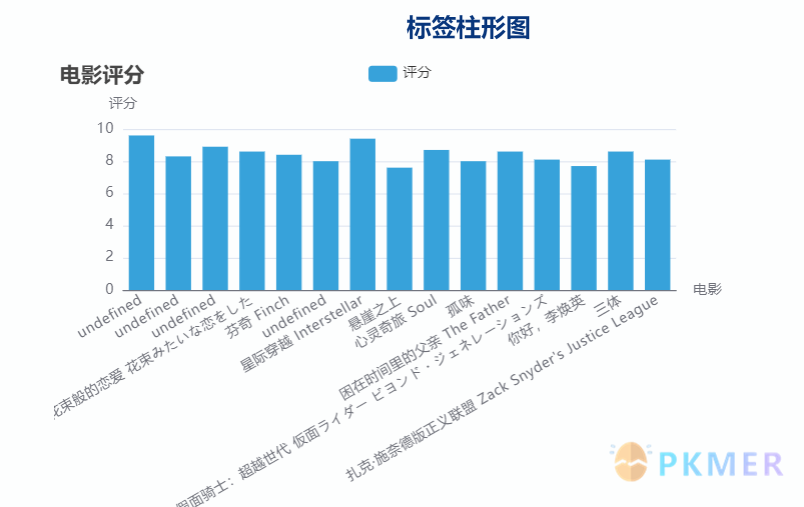
```柱状图
筛选库中 Movie 这个标签下的所有文件,按笔记中 rating 字段的值作为数据源。点击柱状图的笔记是可以直接跳转到对应笔记的。
```dataviewjs
const pages = dv.pages("#Movie").filter((page) => {return page.rating && typeof(page.rating) == "number"})
const ratingList = []
const fileList = []
pages.forEach((page)=>{
	fileList.push(page.name)
	ratingList.push(page.rating)
})
const option = {
	width: 600,
	height: 400,
	grid: {
	  bottom: 200,
	},
	title: {
          text: '电影评分'
        },
	tooltip: {},
	legend: {
	  data: ['评分']
	},
	xAxis: {
	  type: 'category',
      name: '电影',
	  axisTick:{length: 0.1},
	  axisLabel: {rotate: 30,interval: 0, textStyle: {fontSize: "12"}, height: 100},
	  data: fileList
	},
	yAxis: {name: "评分"},
	series: [{
		type: "bar",
		name: "评分",
		data: ratingList
	}]
}
app.plugins.plugins['obsidian-echarts'].render(option, this.container)
```
讨论
若阁下有独到的见解或新颖的想法,诚邀您在文章下方留言,与大家共同探讨。